South Florida’s August 2026 housing snapshot shows a market moving in several directions at once.
Active listings declined year over year in Miami-Dade, Broward and Palm Beach counties, while median asking prices were slightly lower. Pending listings increased compared with August 2025 in all three counties, although they slipped from July 2026.
For buyers and sellers, the takeaway is clear: a smaller pool of available homes does not automatically mean higher asking prices or stronger conditions for every property. Neighborhood, property type and price range remain essential to understanding an individual opportunity
South Florida Housing Market at a Glance
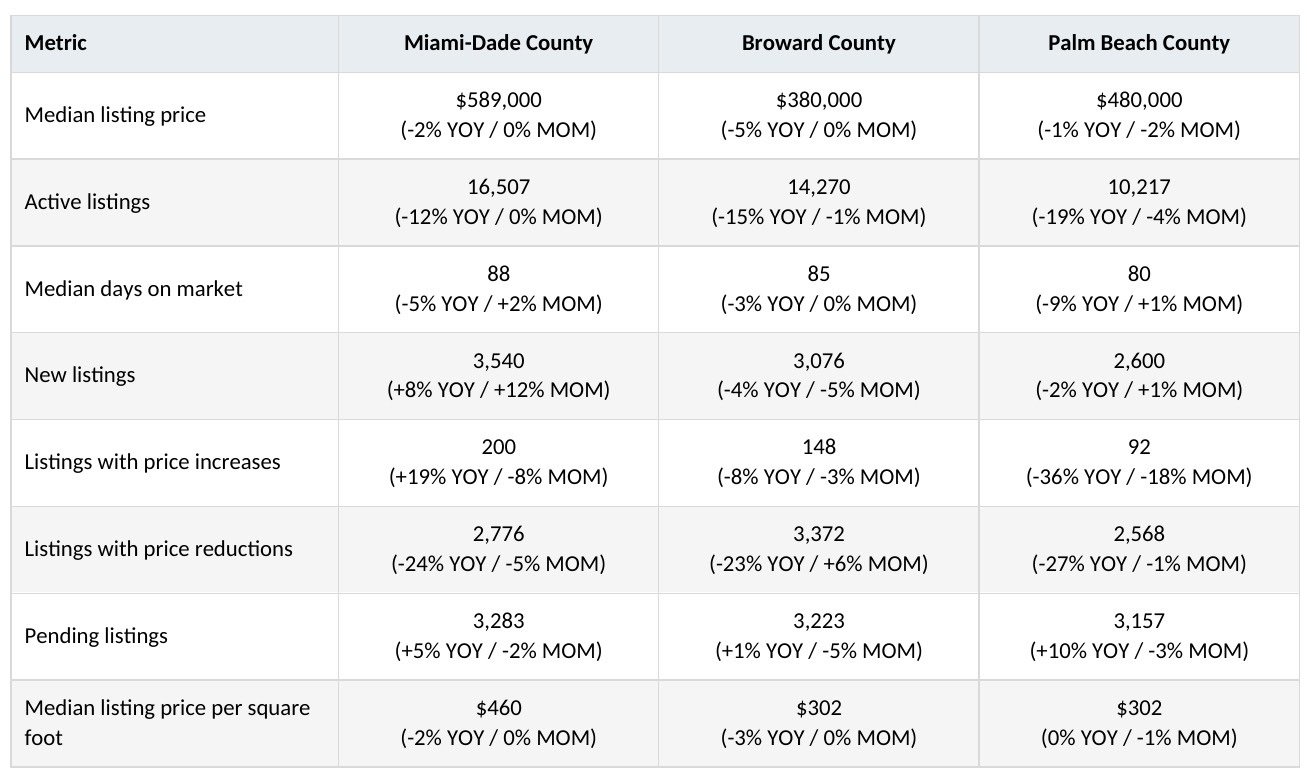
The table below uses the August 2026 figures supplied for this article, attributed to Realtor.com Economic Research an Fir.com. YOY means year over year; MOM means month over month.
Miami-Dade: More New Listings, but Less Active Inventory Than Last Year
Miami-Dade’s median listing price was $589,000 in August 2026, down 2% from a year earlier and unchanged from July. Active listings totaled 16,507, a 12% annual decline.
New listings provided a different signal: 3,540 properties entered the market, up 8% year over year and 12% month over month. Buyers had more fresh options arriving even though the overall active inventory remained below last year.
Pending listings were 5% higher than in August 2025, but 2% lower than in July 2026. Median days on market stood at 88 days, down 5% annually but up 2% monthly.
These figures suggest a market with ongoing activity and replenishing selection, alongside considerable time for properties to find a buyer. They do not establish that every Miami-Dade neighborhood or price segment is becoming more competitive.
Broward: Lower Asking Prices and Continued Price Adjustments
Broward’s median listing price was $380,000, down 5% year over year—the largest annual asking-price decline among the three counties. Active listings fell 15% to 14,270.
New listings declined both annually and monthly, while pending listings were up just 1% from a year earlier and down 5% from July.
Price reductions remained part of the landscape. A total of 3,372 listings had price cuts during August, down 23% annually but up 6% from July. Median days on market held at 85 days, unchanged month over month.
The combination of lower inventory and continuing price adjustments shows why sellers still need to position a home carefully. Reduced competition from other listings does not guarantee acceptance of an ambitious asking price.
Palm Beach: The Largest Annual Inventory Decline
Palm Beach recorded the steepest annual decline in active inventory, down 19% to 10,217 listings. Inventory also fell 4% from July.
The median listing price was $480,000, down 1% year over year and 2% month over month. Pending listings rose 10% annually—the strongest increase of the three counties—but declined 3% from July.
At 80 days, Palm Beach also had the lowest median days on market in this comparison. That figure was 9% lower than a year earlier, although it increased 1% monthly.
Palm Beach therefore showed the strongest combination of annual inventory contraction and growth in pending listings. Its monthly figures were more mixed, so the snapshot should not be read as uninterrupted acceleration.
What Is Behind the Numbers?
Inventory Is Lower, but Scarcity Varies by Segment
All three counties had fewer active listings than a year earlier. That means a smaller overall pool of available properties, but county totals cannot tell us whether a particular waterfront neighborhood, condominium building or single-family price range is undersupplied.
Lower inventory can reflect several factors, including fewer properties coming to market, homes moving into pending status or listings being withdrawn. This snapshot alone does not isolate the cause.
Asking Prices Are Softer, but They Do Not Measure Every Home’s Value
Median listing prices declined between 1% and 5% annually across the three counties. A median is also affected by the mix of homes listed. A larger share of lower-priced properties can pull it down without every individual home losing value.
For that reason, a county-wide asking-price decline should not be applied directly to a specific residence.
Pending Listings Are Above Last Year, but Below July
Pending listings increased year over year in every county, suggesting a larger pool of properties under contract than in August 2025. However, all three counties recorded monthly declines.
Pending inventory is a snapshot of properties under contract. It is not the number of new contracts signed during August and does not guarantee completed sales.
Fewer Price Cuts Do Not Eliminate Negotiation
The number of listings with price reductions fell annually across the region. Active inventory also declined, so fewer reductions alone do not establish that sellers gained negotiating power.
Broward’s monthly increase in price reductions further illustrates the variation within the regional picture.
Asking Prices Versus Closed-Sale Prices: Why the Distinction Matters
Listing prices describe what sellers are asking. Closed-sale prices describe what buyers actually paid. The two measures cover different groups of properties and can move in different directions.
A decline in median asking prices can coexist with an increase in median closed-sale prices if the mix of homes offered and sold changes. Understanding that relationship requires separate closed-sales data for the same period, geography and property type.
Single-family homes, condominiums and townhomes should also be evaluated separately. Measures such as the percentage of original asking price received can add useful context, but they are not included in this listing-data snapshot.
What This Means for South Florida Buyers
Buyers should evaluate the competition around the home they want, rather than assume that a regional asking-price decline guarantees a discount.
Compare recent closed sales, current competing listings, condition and time on market. For condominiums, include association finances, fees and assessments in the evaluation. For distinctive homes, weigh attributes such as waterfront frontage, lot size, architecture and renovation quality.
With median days on market ranging from 80 to 88 days, this snapshot shows that properties generally spent meaningful time on the market. Individual opportunities may move much faster or take longer.
What This Means for South Florida Sellers
A smaller pool of competing listings can help a property stand out, but pricing still needs evidence.
Start with relevant closed transactions and current competition. Account for the home’s condition, location and distinguishing features, then monitor showing activity and buyer feedback.
Presentation and marketing should make the property’s value easy to understand. A county-wide inventory decline is useful context; it is not a substitute for a property-specific pricing strategy.
Frequently Asked Questions
Are South Florida home prices falling?
Median asking prices were lower in August 2026 than a year earlier: down 2% in Miami-Dade, 5% in Broward and 1% in Palm Beach. These are listing-price changes, not a measure of every home’s value or of closed-sale prices.
Which county had the largest decline in active listings?
Palm Beach had the largest annual decline at 19%, followed by Broward at 15% and Miami-Dade at 12%.
How long were properties spending on the market?
Median days on market were 88 in Miami-Dade, 85 in Broward and 80 in Palm Beach. All three figures were lower than a year earlier.
Does this data show a buyer’s market or a seller’s market?
It does not establish either label for the entire region. Inventory, pricing and pending activity provide useful signals, but market balance requires additional context, including closed-sales pace and conditions within the relevant property segment.
The APT TEAM Perspective
For The APT TEAM, this snapshot reinforces the importance of looking beyond a single headline. South Florida’s housing market is a collection of neighborhoods, buildings and property categories, each with its own competitive landscape.
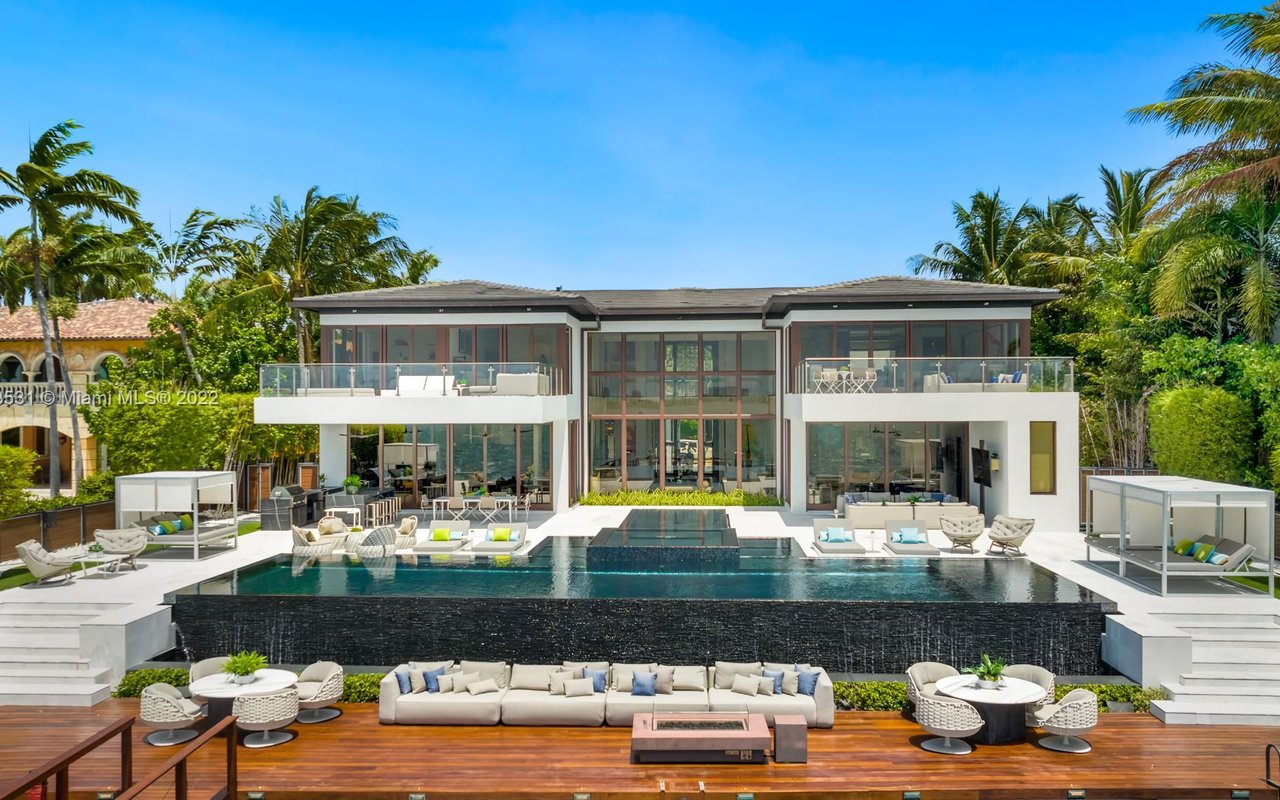
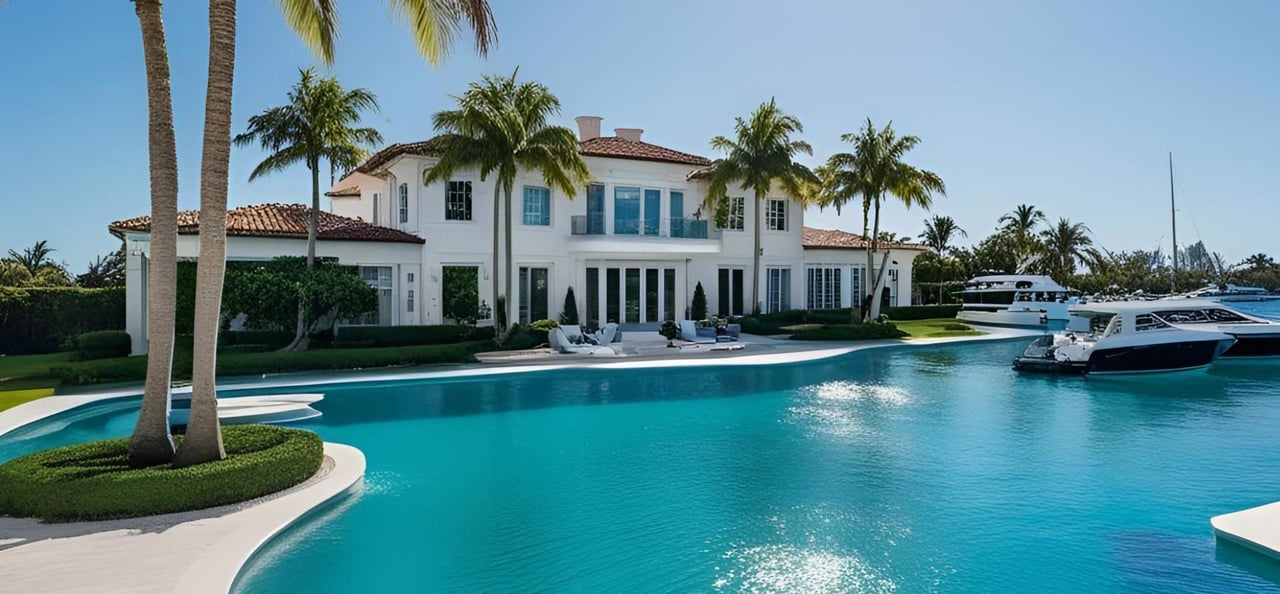
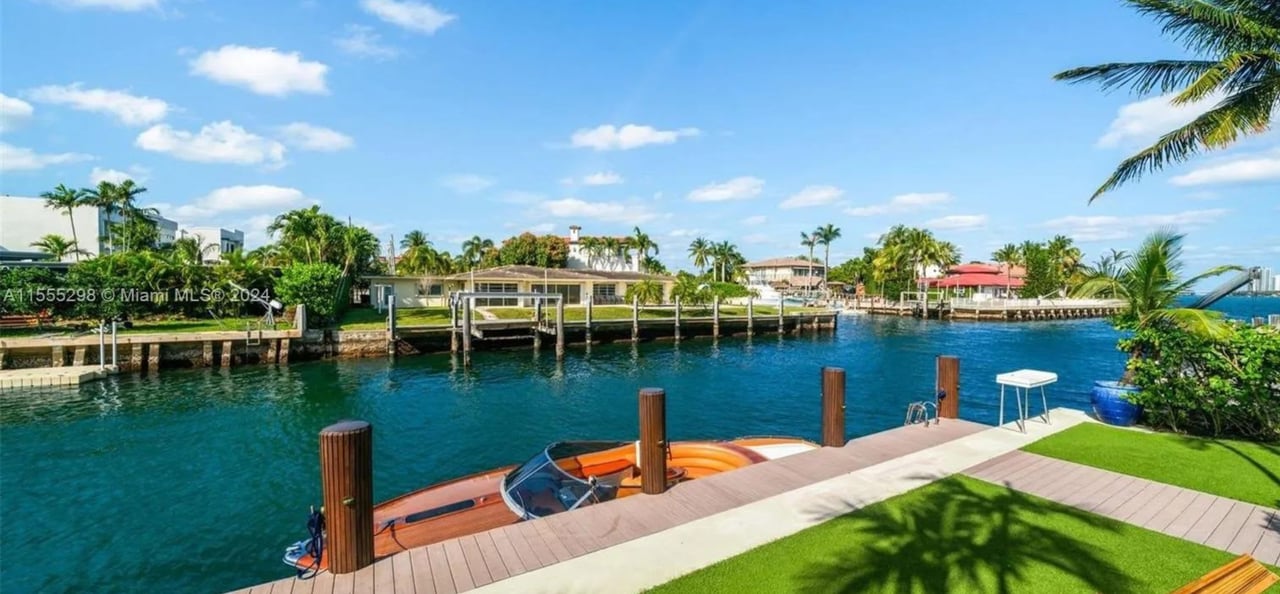
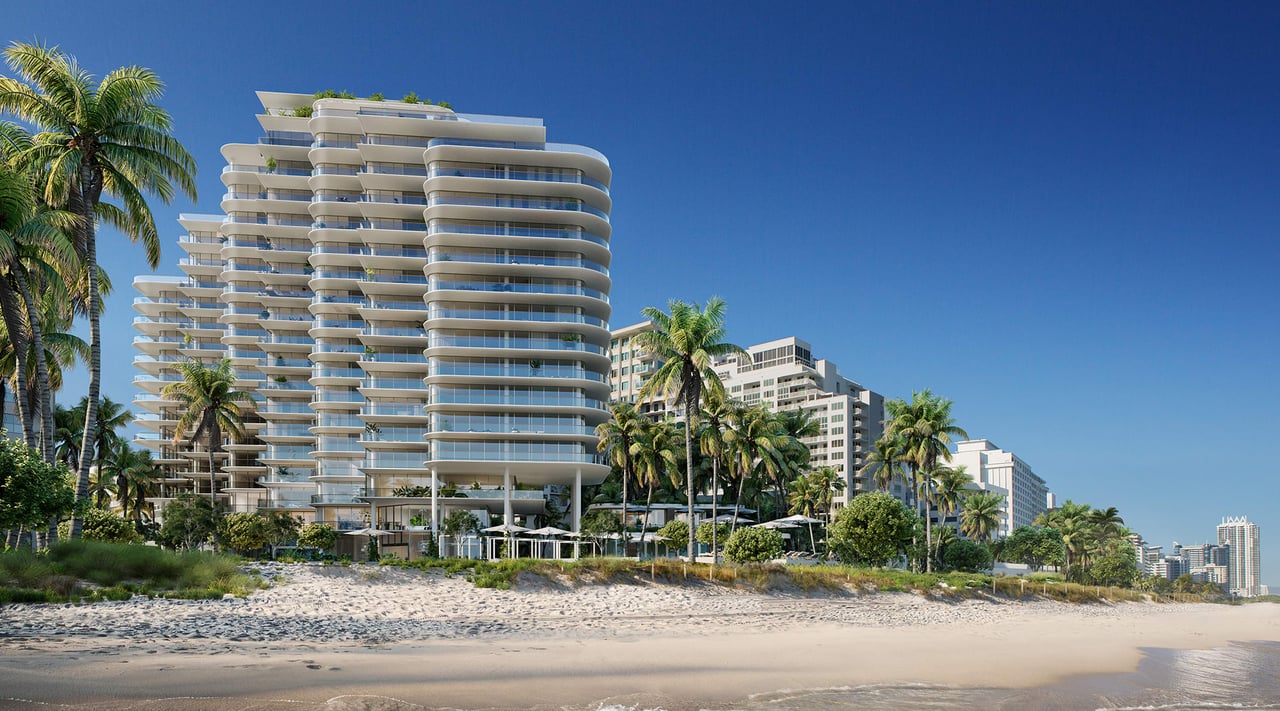
For luxury residences, waterfront homes and new developments, the most useful comparison is the set of properties a buyer would realistically consider. County averages provide perspective, while carefully selected comparable sales and current alternatives guide the decision.
Considering buying or selling in South Florida? Connect with The APT TEAM at theaptteam.com
Source: Fir.com. Market data is sourced from third-party providers and reflects information available at the time of publication. Figures are subject to revision, errors, and omissions.